Free improvement tool
Control chart calculator (individuals and moving range)
Paste one value per time period, in time order, for example daily waiting times in minutes. Everything runs in your browser; nothing is uploaded.
Reading the chart
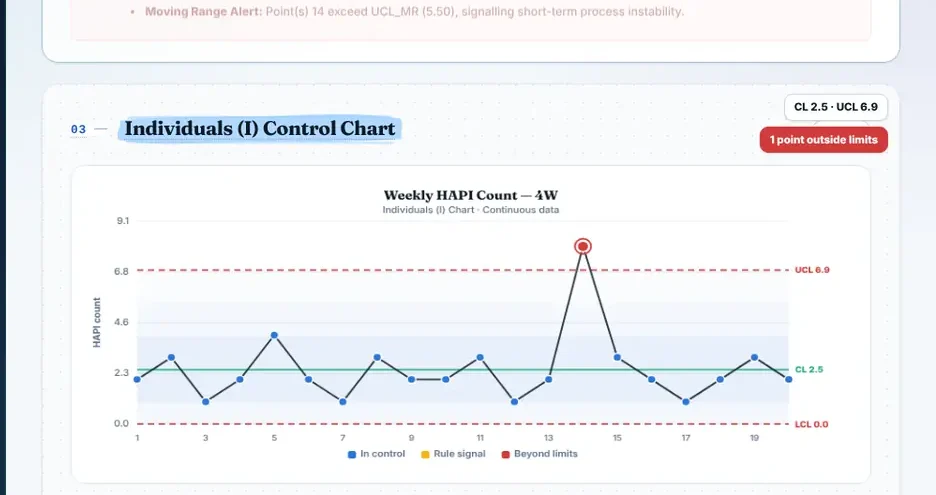
- Points outside the red limits point to a special cause worth investigating.
- A run of 8 or more points on one side of the centre line suggests the process has shifted.
- Do not change a stable process because of one bad day: that adds variation.